Friday

Recycle bin again!

[Sorry for another post on this but i'm not sure how pre-formated text will appear in a comment.]

Claudia left a comment on my last post asking whether or not the recycle bin has affect performance of my entire GL system. From my knowledge we haven't experienced any performance degradation over the past year but I don't have any concrete numbers to back that up since we only keep 30 days of request history. I contacted our functional team and they don't recall of any issues.

If you create an object and there is enough space to fulfill that request then the response time is a few hundredths of a second. However, if Oracle has to purge the recycle bin to free up space then this could affect performance dramatically. Since we monitor frequently for next extent, then chances are there is enough continuous free space for the request. But I can't rule it out.

A quick test:


--Query to show the amount of fragmentation in GLD:

SQL> select bytes/1024/1024, count(*)
2 from dba_free_space
3 where tablespace_name = 'GLD'
4 group by bytes/1024/1024
5 /

BYTES/1024/1024 COUNT(*)
--------------- ----------
.0390625 9
.1953125 16325
.5078125 15742
.078125 20
.2734375 42
405.390625 1

6 rows selected.

Elapsed: 00:05:45.43

-- Create a table with an intial size that will fit in one of the above chunks

SQL> create table t1 (name varchar2(10)) tablespace GLD storage (initial 300M);

Table created.

Elapsed: 00:00:00.74

-- How about a request larger than 405MB?

SQL> create table t1 (name varchar2(10)) tablespace GLD storage (initial 600M);
^Ccreate table t1 (name varchar2(10)) tablespace GLD storage (initial 600M)
*
ERROR at line 1:
ORA-00604: error occurred at recursive SQL level 1
ORA-01013: user requested cancel of current operation


Elapsed: 00:18:44.55


I killed it after 18minutes! So, if your recycle bin contains alot of objects and there isn't a large enough chunk of space to fulfill a request then performance can be severely affected. As I mentioned in one of my previous posts, to clean up GL it took 4 or so hours. Maybe over the weekend when there isn't as much activity on our test system I'll let it run to completion.

For those interested, after 18minutes here is a breakdown of freespace in GLD :


BYTES/1024/1024 COUNT(*)
--------------- ----------
48.984375 1
1.015625 1
2.03125 1
.0390625 9
2.5390625 1
58.671875 1
8.6328125 1
.1953125 14614
51.2890625 1
.5078125 14744
403.75 1
11.6796875 1
56.3671875 1
56.4453125 1
15.7421875 1
.078125 17
.2734375 45
66.875 1
19.8046875 1
1.5234375 1
35.0390625 1
405.390625 1
10 1

23 rows selected.

Elapsed: 00:03:57.03
Wednesday

Recycle bin and Fragmentation

Yesterday I posted about the recycle bin and how if you don't purge, it may affect performance of queries touching dba_free_space. We have had fragmentation issues and growth issues in certain tablespaces for awhile now.. We tried a couple of things to resolve it but they didn't work. I've been pushing to migrate our 11i environment to OATM (Oracle Applications Tablespace Model) for awhile thinking it would resolve our fragmentation issues by having a lower number of tablespaces with uniform extent sizes.

One of the tablespaces with fragmentation problems is GLD and GLX, data and index tablespaces for the GL module. As I noticed yesterday, most of the objects in the recycle bin were owned by GL and shortly after I posted the article I wondered if recycle bin was the source of our problems here as well.

Here is a query from dba_free_space which shows you the available free chunks of space and how many of them there are:


SQL> Select bytes/1024/1024, count(*)
2 From dba_free_space
3 Where tablespace_name = 'GLX'
4 group by bytes/1024/1024
5 /

BYTES/1024/1024 COUNT(*)
--------------- ----------
.0390625 25351
55.5859375 1
.1953125 9
.078125 10072


Lots of very small unusable chunks. So what happens to the chunks of free space if I purge the recycle bin?


1 Select bytes/1024/1024, count(*)
2 From dba_free_space
3 Where tablespace_name = 'GLX'
4 group by bytes/1024/1024
5* order by 1 DESC
SQL> /

BYTES/1024/1024 COUNT(*)
--------------- ----------
202.929688 1
138.984375 1
122.578125 1
107.109375 1
104.726563 1
103.554688 1
90.4296875 1
81.484375 1
[SNIP]


After the purge the largest chunk of same size fragments is 6. Quite a significant difference.... So the question is, why isn't Oracle reusing space of objects in the recycle bin? The answer is very simple. We have a custom alarm script which monitors next extent sizes and runs twice a day. If the alarm triggers, a page is sent to the DBA on call and typically they should perform the following steps:

1. Check and see how much free space is left in the tablespace.
2. Check the next_extent size of the object and make sure its not an unreasonably large request. (Some objects still have pct_increase > 0. Grr!)
3. If number 2 is true resize the next_extent, otherwise add more space to the tablespace.

Recycle bin is a "non-instrusive" feature and space will be reclaimed if:*
  • A user creates a new table or adds data that causes their quota to be exceeded.

  • The tablespace needs to extend its file size to accommodate create/insert operations


*Note: 265253.1

So, when Oracle comes along and needs to grow an object, we have already added a large chunk of space. Logically, Oracle will fulfill its request from this new chunk before reclaiming space from the recycle bin. If i'm mistaken in this conclusion please correct me.

I wonder if we were using OATM with uniform extent sizes would I have noticed this sooner? If I had 25000 extents of a uniform size (which would be the same as the request size) showing in dba_free_space i'm sure I would have investigated why they weren't being reused.

While I was reading up on the recycle bin and flashback drop preparing my last post I didn't recall seeing any gotcha's like this. So heads up, if your using GL (or have an application which using alot of interim tables) then this is a potential gotcha.

Tuesday

Recycle Bin and Performance

10G introduced a new feature FLASHBACK DROP. FLASHBACK DROP enables a user to quickly undo the previously disastrous mistake of dropping a table. Well, disastrous is a strong word but depending on your environment it most likely isn't a fun experience.

As a side and somewhat unrelated note, many years ago at a previous company it was noticed that data was missing from one table. I believe at the time we were either on 8i or 7.3.4. They weren't sure exactly when the problem started so we had to perform many point in time recoveries. By the end of the exercise I believe I had completed over 30 recoveries!

I won't go into detail on how to use flashback drop. Between Oracle's documentation and numerous blog posts this topic has been covered quite a bit. In a nutshell, when you drop an object (tables, indexes, constraints, etc) the space occupied by the object isn't released immediately. This is the behaviour in 8i/9i as well. However, in 10g, the object is renamed and placed in a recycle bin. The recycle bin is actually a data dictionary table which contains information on dropped objects and is required for FLASHBACK DROP to work. This feature is controlled by an initialization parameter and it is not included in the list of mandatory 11i initialization parameters (Note:216205.1) but by default it is enabled.

A quick example:


SQL> show parameter recyclebin

NAME TYPE VALUE
------------------------------------ ----------- ------------------------------
recyclebin string on

SQL> create table t1 (name varchar2(2));

Table created.

SQL> insert into t1 values ('hi');

1 row created.

SQL> commit;

Commit complete.

SQL> select * from t1;

NA
--
hi

SQL> drop table t1;

Table dropped.

SQL> show recyclebin;
ORIGINAL NAME RECYCLEBIN NAME OBJECT TYPE DROP TIME
---------------- ------------------------------ ------------ -------------------
T1 BIN$RxJptgohQevgRAADugOWhQ==$0 TABLE 2008-02-26:10:35:00

SQL> select * from t1;
select * from t1
*
ERROR at line 1:
ORA-00942: table or view does not exist


SQL> flashback table t1 to before drop;

Flashback complete.

SQL> select * from t1;

NA
--
hi


Since we upgraded to 10g I've noticed that the tablespace page in Database Control, which shows you the amount free/used space, has been taking longer and longer to load. As well, the following query has been flagged as consuming more resources than normal:


insert into mgmt_db_size_gtt select tablespace_name,NVL(sum(bytes)/1048576, 0) sz from sys.dba_free_space group by tablespace_name


The reason is because the dba_free_space view now references the sys.recyclebin$ as well. So as the recyclebin table grows, some queries such as the one above and the underlying query(s) of the tablespace page in DB Control get slower over time. (Anything that touches the dba_free_space view.) The solution is to purge the recycle bin. You can purge individual objects, objects owned by a particular user or system wide. Example:

SQL> purge recyclebin;

Recyclebin purged.


Before I purged the recycle bin system wide I thought it would be interesting to see who the culprit was.


1 select owner, count(*)
2 from dba_recyclebin
3 group by owner
4* order by 2 desc
SQL> /

OWNER COUNT(*)
------------------------------ ----------
GL 86089
APPS 698
BNE 50
[snip]


GL by far has the most object consisting of tables and indexs:


1 select type, count(*)
2 from dba_recyclebin
3 where owner = 'GL'
4 group by type
5* order by 2 desc
SQL> /

TYPE COUNT(*)
------------------------- ----------
INDEX 54966
TABLE 31123


Diving deeper I found that this is caused by Mass Allocation. I'm debating whether or not to disable the recycle bin feature or at the very least schedule a script to purge objects older than X days. In our test environment, a system wide purge of 89k objects took 4hrs. Anyways, if someone accidentally drops a table, then we are going to know about it right away! The only apps related issue I have found is a conflict with a patch where the AD_DEFERRED_JOBS table couldn't be created even tho it didn't currently exist.

Relevent Metalink notes:

Note:390413.1 - ORA-38301 During Installation Of Patch 4709948
Note:271169.1 - Queries on DBA_FREE_SPACE are Slow
Note:414256.1 - Poor Performance For Tablespace Page Display In Grid Control Console
Note:265253.1 - 10g Recyclebin Features And How To Disable it( _recyclebin )

Thursday

Jinitiator and the Google Toolbar


A little while ago I started getting the following error when trying to launch a responsibility.


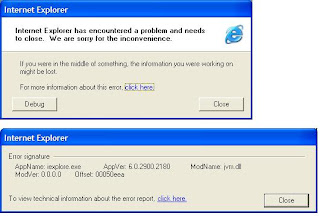
There have been no changes to my laptop that i'm aware of. However, my company does use a tool to push patches out and if a reboot wasn't required I may not have noticed. Via Add and Remove programs I checked for updates and there has been no activity lately.

I followed Note:430359.1 which details how to troubleshoot IE crashes when launching forms. Following the steps I determined that the root cause of my problem is the Google Toolbar. I recently migrated to a new laptop and indeed I have the same problem there, which goes away after disabling it.

To disable the google toolbar and within Internet Explorer click on Tools -> Internet Options -> Programs (Tab) -> Manage Add-ons (Button). Click on Google and at the bottom of the window there will be an option to disable it. Perform the same action for google Toolbar Helper.

Below is an image of my add-on's showing Google as disabled.


I performed a google search and apparently IE with certain 3rd party add-ons has been a problem for awhile, with at least one site containing a list of which ones should be disabled. I reviewed the jinitiator install notes, etc but nothing specifically mentions 3rd party add-ons. In my case, I have had the google toolbar installed for ages without issue so I was surprised to find it as the culprit.

OTL Performance problems

For a while now we have been investigating a performance issue within OTL. Specifically in the Create Timecard screen when users select a week and click on the Go button. This query could take upwards of a couple of minutes to execute.

The applications team has been working with Oracle and tried a few suggestions. More aggressive statistics gathering, some data purging, etc. I had some free time so I decided to dig into it myself. The first thing I tried was to see if I could reproduce the issue in a test environment. The test environment is refreshed nightly from production via rman's duplicate feature. So, the environments are identical. I could not reproduce the issue so that meant a couple of things. Either the problem is load induced (production has hundreds of concurrent users) or the environments weren't identical.

Since I know the database is identical, I looked at init parameters. Oracle has a handy script which builds a report of initialization parameters and required values. This can be found in note: 174605.1

When I compared the production vs test report, I noticed some discrepancies. Fortunately the parameters in question were dynamic, so they could be changed and the issue re-tested. The problem was not resolved so I had to dig a little deeper.

I am by no means an expert in SQL tuning. Working with packaged applications doesn't really provide me with alot of opportunities to dig in. Here is the explain plan for test:


----------------------------------------------------------------------------------------------------
| Id | Operation | Name | Rows | Bytes | Cost |
----------------------------------------------------------------------------------------------------
| 0 | SELECT STATEMENT | | 1 | 96 | 5 |
| 1 | SORT ORDER BY | | 1 | 96 | 5 |
| 2 | FILTER | | | | |
| 3 | CONNECT BY WITH FILTERING | | | | |
| 4 | TABLE ACCESS BY INDEX ROWID | HXC_TIME_BUILDING_BLOCKS | 2 | 240 | 162 |
| 5 | BITMAP CONVERSION TO ROWIDS | | | | |
| 6 | BITMAP OR | | | | |
| 7 | BITMAP CONVERSION FROM ROWIDS| | | | |
| 8 | SORT ORDER BY | | | | |
| 9 | INDEX RANGE SCAN | HXC_TIME_BUILDING_BLOCKS_PK | | | 3 |
| 10 | BITMAP CONVERSION FROM ROWIDS| | | | |
| 11 | INDEX RANGE SCAN | HXC_TIME_BUILDING_BLOCKS_FK2 | | | 14 |
| 12 | NESTED LOOPS | | | | |
| 13 | BUFFER SORT | | | | |
| 14 | CONNECT BY PUMP | | | | |
| 15 | TABLE ACCESS BY INDEX ROWID | HXC_TIME_BUILDING_BLOCKS | 1 | 96 | 4 |
| 16 | INDEX RANGE SCAN | HXC_TIME_BUILDING_BLOCKS_FK3 | 3 | | 3 |
| 17 | TABLE ACCESS FULL | HXC_TIME_BUILDING_BLOCKS | 5336K| 610M| 26435 |

Statistics
----------------------------------------------------------
0 recursive calls
0 db block gets
14 consistent gets
0 physical reads
0 redo size
2024 bytes sent via SQL*Net to client
464 bytes received via SQL*Net from client
2 SQL*Net roundtrips to/from client
6 sorts (memory)
0 sorts (disk)
1 rows processed


Production:


------------------------------------------------------------------------------------------------
| Id | Operation | Name | Rows | Bytes | Cost |
------------------------------------------------------------------------------------------------
| 0 | SELECT STATEMENT | | 1 | 96 | 5 |
| 1 | SORT ORDER BY | | 1 | 96 | 5 |
| 2 | FILTER | | | | |
| 3 | CONNECT BY WITH FILTERING | | | | |
| 4 | TABLE ACCESS FULL | HXC_TIME_BUILDING_BLOCKS | 2 | 240 | 26485 |
| 5 | NESTED LOOPS | | | | |
| 6 | BUFFER SORT | | | | |
| 7 | CONNECT BY PUMP | | | | |
| 8 | TABLE ACCESS BY INDEX ROWID| HXC_TIME_BUILDING_BLOCKS | 1 | 96 | 4 |
| 9 | INDEX RANGE SCAN | HXC_TIME_BUILDING_BLOCKS_FK3 | 3 | | 3 |
| 10 | TABLE ACCESS FULL | HXC_TIME_BUILDING_BLOCKS | 5336K| 610M| 26435 |
------------------------------------------------------------------------------------------------


Statistics
----------------------------------------------------------
0 recursive calls
0 db block gets
95708 consistent gets
94802 physical reads
0 redo size
2024 bytes sent via SQL*Net to client
464 bytes received via SQL*Net from client
2 SQL*Net roundtrips to/from client
5 sorts (memory)
0 sorts (disk)
1 rows processed


The query requires 14 consistent gets in test but 95708 in production! Ouch. I was pretty sure that was our problem right there but how to prove it. I noticed the test environment query was using indexes that productions wasn't, so I tried the query with some index hints. That didn't work. To make a long story short the cause is a bug:

Bug 6282093 - Cost based CONNECT BY does not OR expand START WITH
Note:6282093.8


The recommended action plan from Oracle is to upgrade to 10.2.0.3 and apply a one off-patch. There is a workaround, set "_optimizer_connect_by_cost_based" to false but i'm not sure if it will have an adverse impact on other areas of the application. Since its a dynamic parameter, I am going to ask that give it a try. Worst case, if performance tanks somewhere else I can quickly revert the change.

If you are on 11.5.10 CU2, DB 10.2.0.2 and have set this parameter, please let me know if you have experienced any issues. I'm still curious why I can't reproduce the issue in an identical environment tho. The only other variables in the equation are that the servers aren't identical (which could affect execution plans) or rman's duplicate feature isn't identical enough?

Wednesday

ORA-20100 and FIND_FILE

BEGIN
*
ERROR at line 1:
ORA-20006: ORA-20100: File l0005230.tmp creation for FND_FILE failed.
You will find more information on the cause of the error in request log.
ORA-06512: at "APPS.OUR_CUSTOM_CODE", line 949
ORA-06512: at line 2

Thats how I started my day. To say I hate ORA-20100 errors would not accurately portray my feelings. However, after reading Tom Kytes blog posting titled "Why do people do this?" I know why. Guess what is on line 949. ;)

Unlike previous occurrences of this error, its a concurrent manager temp file. So I know right away that the directory in question is pointed to by the environment variable APPLPTMP.

We have hit this error before and usually its the utl_file_dir database parameter. I guess some of us DBA's have fat fingers and even tho we double check this parameter, sometimes a typo sneaks through during cloning. I have a script which writes to each of our utl file directories. So I could rule this out as being a problem.

I can't remember where I obtained the code below, but here is what I use. I write to a file, then try and read from it. Exceptions below give me a good indication of what the problem may be.

CREATE OR REPLACE PROCEDURE utl_test IS
file_handle UTL_FILE.FILE_TYPE; -- file handle of OS flat file
col1 NUMBER; -- C1 retrieved from testtab table
retrieved_buffer VARCHAR2(100); -- Line retrieved from flat file
BEGIN
file_handle := UTL_FILE.FOPEN('dir1', 'filetest.txt', 'W');
UTL_FILE.PUT_LINE(file_handle, 'This is a test');
UTL_FILE.FCLOSE(file_handle);
file_handle :=utl_file.fopen('dir1', 'filetest.txt', 'R');
UTL_FILE.GET_LINE(file_handle, retrieved_buffer);
dbms_output.put_line(retrieved_buffer);
utl_file.fclose(file_handle);
EXCEPTION
WHEN NO_DATA_FOUND THEN
DBMS_OUTPUT.PUT_LINE('no_data_found');
UTL_FILE.FCLOSE(file_handle);
WHEN UTL_FILE.INVALID_PATH THEN
DBMS_OUTPUT.PUT_LINE('UTL_FILE.INVALID_PATH');
UTL_FILE.FCLOSE(file_handle);
WHEN UTL_FILE.READ_ERROR THEN
DBMS_OUTPUT.PUT_LINE(' UTL_FILE.READ_ERROR');
UTL_FILE.FCLOSE(file_handle);Troubleshooting ORA-20100 on Concurrent Processing
WHEN UTL_FILE.WRITE_ERROR THEN
DBMS_OUTPUT.PUT_LINE('UTL_FILE.WRITE_ERROR');
UTL_FILE.FCLOSE(file_handle);
END;


The next common resolution was to check the location to which the APPLPTMP environment variable points. We have multiple environments on our test dev servers and its not uncommon for one environment to own a tmp file, thus blocking another environment from writing to it. In this case, the file l0005230.tmp existedand was owned by the proper user but was zero size.

-rw-r--r-- 1 oravis dba 0 Feb 5 10:06 l0005230.tmp

We have hit OS fragmentation issues in the past. Just to be safe I copied a large file to the tmp directory without a problem. We have had partitions with 20GB free and have been unable to create a 100k file. A system reboot usually fixed that.

I was out of ideas. I have never gotten this far with this particular error before. So I fired up Metalink. Note:261693.1 Troubleshooting ORA-20100 on Concurrent Processing, listed the options I have tried above and a few more. One suggestion is to use FND_FILE which is the package used by the application to write to OS files.

SQL> exec FND_FILE.PUT_LINE(FND_FILE.LOG, 'THIS IS A TEST');

If everything is setup correctly, this will write to a file in the directory pointed to by APPLPTMP. Don't go to this directory looking for a file named FND_FILE.LOG. You won't find it. The data, "THIS IS A TEST", will be written to a temp file. So look at tmp files created around the time you executed that command.

$cat l0006340.tmp
THIS IS A TEST


So at this point, none of the suggested troubleshooting steps have pinpointed the problem. To summarize, we have verified:
  • that the UTL_FILE_DIR init parameter is correct and each location is writeable.
  • that the application should be able to write to the OS using FND_FILE. The file does get created but the app can't write data to it.
The only thing left was to try restarting services. A bounce of the concurrent managers didn't resolve the issue. So we bounced the entire application and database. This finally resolved the issue. Why? No idea. There were a bunch of processes that didn't shutdown properly so we killed them. Maybe one of those had a resource open that was blocking. If you have encountered this before and found the root cause, feel free to share the information. ;)